Forgotten Graphs #1: ln(x)
- Ashish Sharma

- Apr 3
- 2 min read
Welcome to this series of blogs where I look at common graphs across the A level course which students struggle to recall during practice papers and even in the exam.
Today's blog focusses on ln(x).
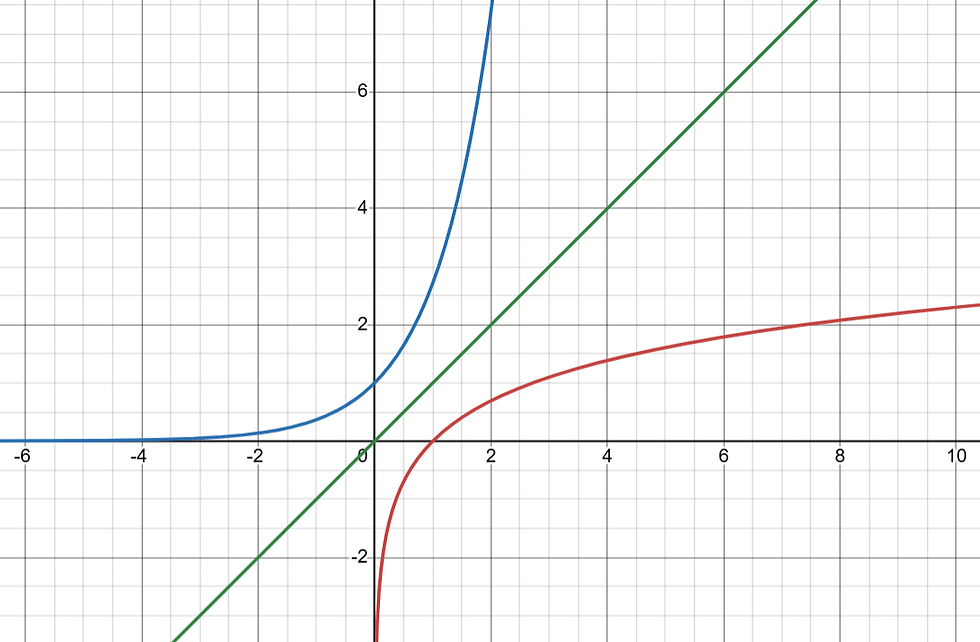
The ln(x) graph can be drawn by effectively reflecting the y=e^x graph in the line y=x. In this respect ln(x) is the inverse function of the exponential function.
Most students are OK with recalling the exponential function but often do not remember the ln(x). I believe its down to a variety of factors:
the ln(x) graph is not covered to a lot of detail in the Year 12 curriculum.
there are not many questions in past papers where they ask students to transform the graph- this create a lack of exposure and hence lack of familiarity.
Lets focus on the important aspects of the ln(x) in more detail:

The key features of the ln(x) graph are:
It cuts the x-axis at 1.
It does not touch the y-axis, hence the y-axis is an asymptote.
It increases in value in the positive y -axis after x=1.
It has no horizontal asymptote.
Questions involving ln(x) don't come up regularly but when they do it can be linked with problems involving:
Transforming the ln(x) graph and finding the image of certain points after transformation.
Sketching the ln(x) as it is or after transformation.
Domain and Range.
Applying a modulus function on ln(x).
Iteration to find intercepts and points of intersection.
Testing your knowledge on the relationship of ln(x) and e^x.
Therefore its in your best interest to memorise this graph and its important features!


Comments